Updated 08 May 2012
|
Dorset Stour - Monitoring Stations
|
|
Dorset Stour - Monitoring stations.
|
Measuring the delay between rain falling and level
pulse arriving at different places along a river.
Approx. calibration between these places and Bear Mead.
Transit speeds calculated from distance along the river.
Dorset Stour used over 57 miles. Data from
Environment Agency Level monitoring stations,
BBC weather radar records,
and Google Earth tools.
| |
Environment Agency say:
"The site on the Stour at Hammoon is near Sturminster Newton, Dorset.
The gauging structure is under the road bridge which crosses the Stour at
Hammoon. There is a compound crump weir at the site and measurements of
level are taken every 15 minutes using pressure transducer technology,
stored on site, then transferred from the site via telemetry to the local
office at least once a day. From here the data are automatically transferred
to our website where they are presented on the graph. As this is a flow
monitoring site measurements of level are also converted to flow on our
hydrometric archive."
|
The Dorset Stour, 72 miles from source to mouth,
showing the 9 monitoring stations along its length.
|
 |
Source of the River Stour,
at St Peter's Pump in Stourhead Gardens,
Wiltshire.
|
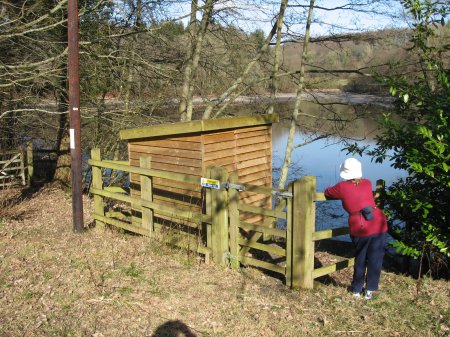
1. Gasper Dam, ST7676-3291 |
MS is inside wooden shed on Lake side.
 |
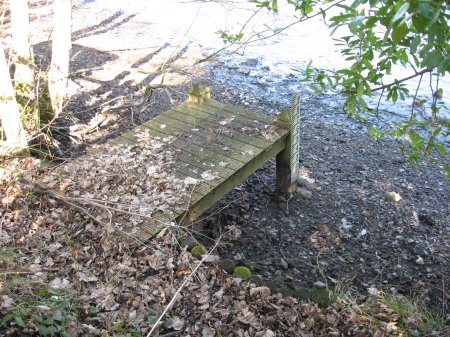
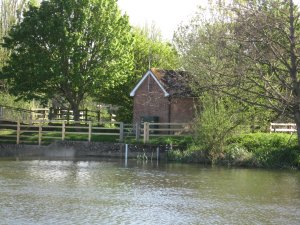
A small jetty with depth scale and cable.
 |
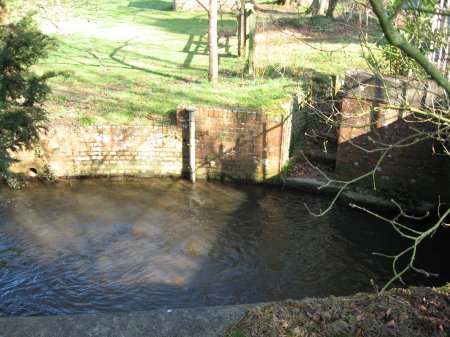
Brick lined river bank with plumbing connected to MS.
 |
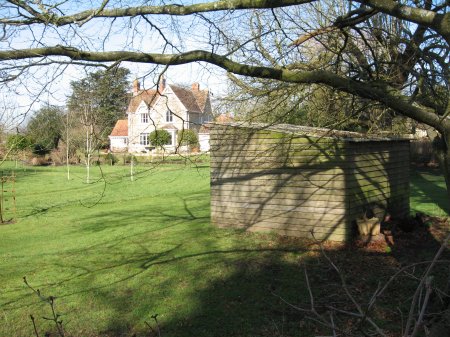
MS is inside wooden shed in a private garden.
 |
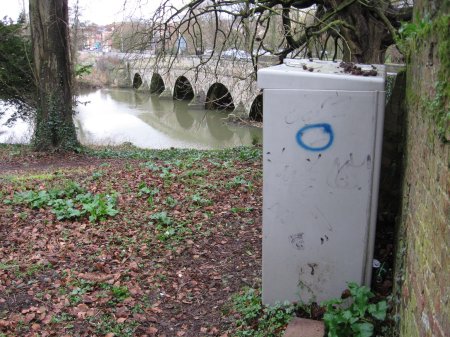
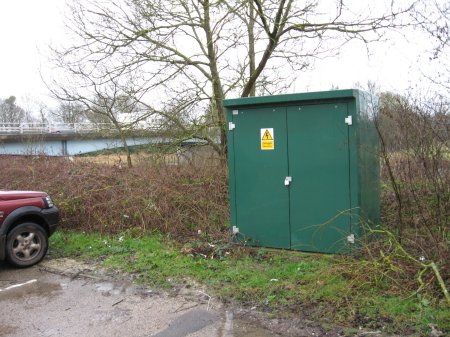
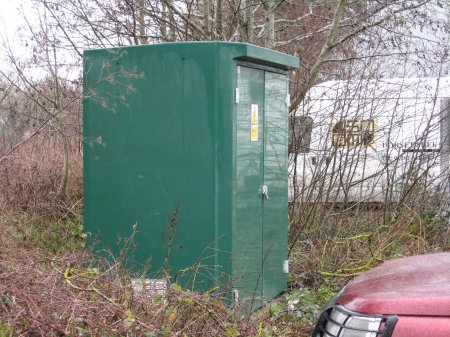
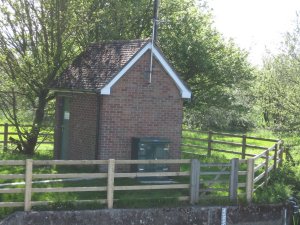
MS is inside green box by the bridge.
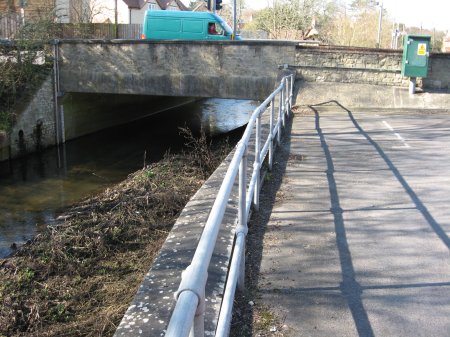 |
Stour downstream from Le Neubourg Way bridge.
 |
MS in brick building next to bridge.
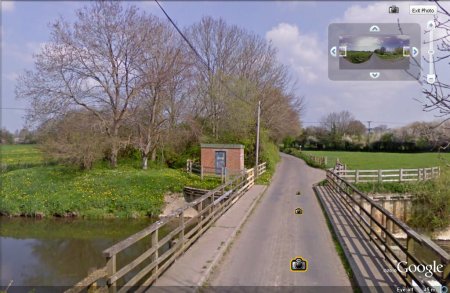 |
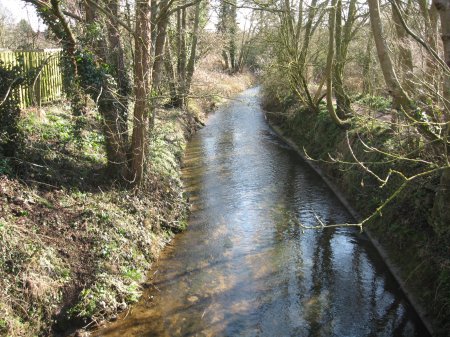
From Hammoon bridge downstream (South).
 |
MS by Blandford Bridge.
 |
MS behind wall from road.
 |
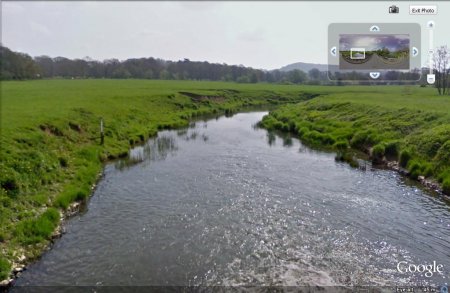
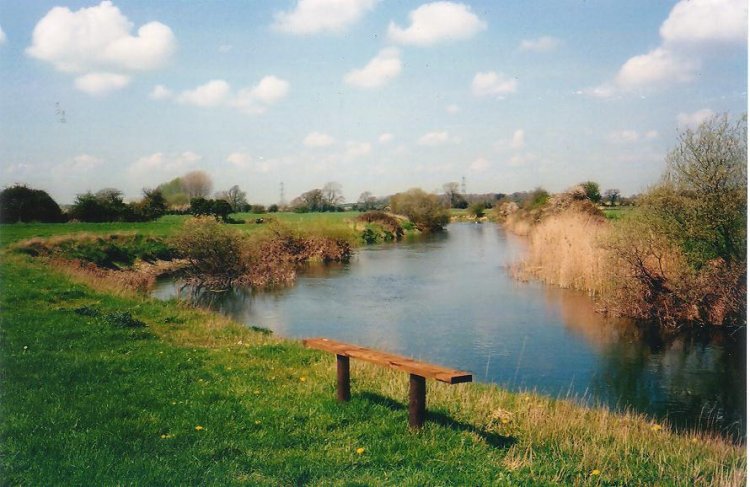
6. Bear Mead, SY9863-9930 |
Upstream at Bear Mead private Nature Reserve.
 |
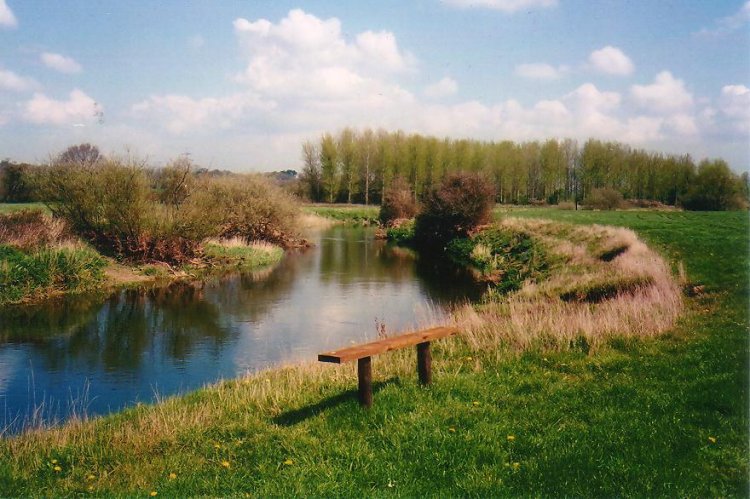
Downstream. Level is measured daily by Author.
 |
MS by Wimborne bypass (A31) over Stour.
 |
MS at rear of small industrial estate.
 |
MS on Stour.
 |
MS near Sewage Works with cables crossing river.
 |
9. Throop, ID=3303, SZ1123-9602 |
MS by Stour.
 |
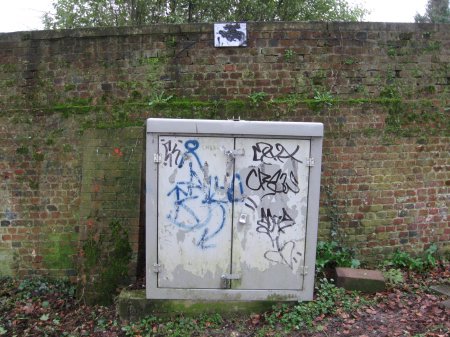
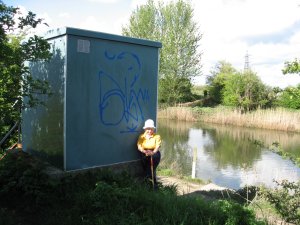
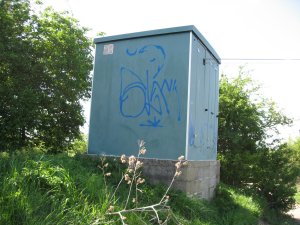
MS is green box against Gauging Station wall.
 |
 |
Mouth of the River Stour,
in Christchurch Harbour, Dorset
|
|
|
The river is over 72 miles from Source to Mouth.
The length of the Stour, along the river including all meanders,
was measured by using Google Earth with 'Tools-ruler-path'
facility, together with Philip's Street Atlas 3.5in=1mile.
The Stour rises at St Peters Pump, near Stourhead,
but can be under the surface for some distance in dry months.
It reaches the sea in Christchurch Harbour.
|
|
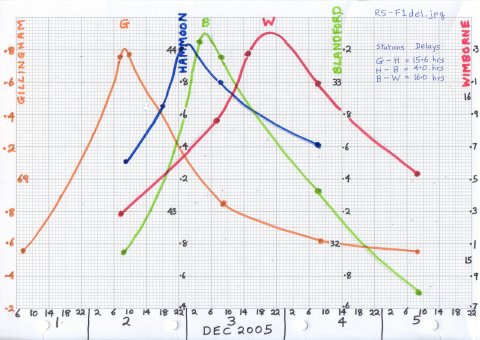
Graphs drawn by author based on copyright data kindly supplied
by Environment Agency of daily river levels 2003-2011 from
recording stations shown.
|
Profile (miles) and delay (hours)
on Dorset Stour for Flood-1 (Dec 2005).
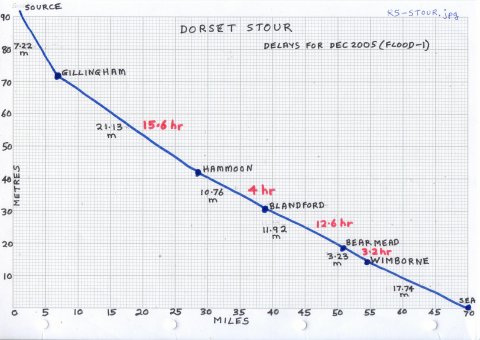 |
Delay of Flood-1 pulse (hrs):
Gill-15.6-Hamm-4-Bland-12.6-(BEAR MEAD)-3.2-Wimb.
 |
Floods >350 and High waters >300 |
Copyright data kindly supplied by Environment Agency of
daily river levels 2003-2011 from monitoring stations shown.
|
             mAW         mAW    mAW                     mAW
   Date      Gillingham Hammoon Blandford Bear Mead     Wimborne
03 Dec 2003   -         2.63    1.21      305            -
09 Jan 2004   -         2.57    1.17     (313)           -
13 Jan 2004   -         2.76    1.47     (336)           -
02 Feb 2004   -         2.81    1.55     (344)           -
30 Oct 2004   -         2.67    1.22      300            -
21 Dec 2004   -         2.86    1.65      305            -
03 Dec 2005  1.68       3.11    2.26      375 Flood-01  1.68
27 Nov 2006  1.69       2.76    1.84      370 Flood-02  1.48
01 Jan 2007  1.12       2.90    1.86      356 Flood-03  1.52
19 Jan 2007  0.96       2.34    1.11      304           1.09
25 Feb 2007  1.45       2.69    1.38      330           1.19
07 Mar 2007  1.14       2.85    1.74      348 Flood-04  1.46
05 Jul 2007  1.51       2.59    1.14      314           0.98
22 Nov 2007  1.21       2.74    1.41      336           1.23
10 Dec 2007  1.20       2.62    1.22      318           1.19
13 Jan 2008  1.43       2.77    1.24      350           1.24
16 Jan 2008  1.43       2.95    1.96      362 Flood-05  1.53
11 Mar 2008  0.77       2.37    1.12      300           1.04
17 Mar 2008  1.58       2.88    1.82      356 Flood-06  1.43
27 May 2008  1.16         -     0.92      314           1.01
29 May 2008  0.59       2.31    0.99      304           0.99
30 May 2008  1.60       2.31    1.09      315           1.00
04 Jun 2008  0.55       1.82    0.97      308           0.88
11 Jul 2008  1.89       2.45    1.11      310           0.99
11 Nov 2008  1.56       2.81    1.44      314           1.10
14 Dec 2008  1.70       2.94    1.76      356 Flood-07  1.40
19 Jan 2009  1.09       2.57    1.17      312           1.15
25 Jan 2009  1.37       2.75    1.42      337           1.18
07 Feb 2009  0.70       2.54    1.19      322           1.09
11 Feb 2009  1.94       3.05    2.12      376 Flood-08  1.62
16 Nov 2009  1.39       2.84    1.49      340           1.24
01 Dec 2009  1.29       2.83    1.51      358 Flood-09  1.26
04 Dec 2009  1.38       2.80    1.45      356 Flood-10  1.25
09 Dec 2009  1.29       2.78    1.44      362 Flood-11  1.32
18 Jan 2010  1.09       2.78    1.51      354           1.35
23 Jan 2010  1.43       2.65    1.25      300           1.07
09 Jan 2011  1.07       2.54    1.12      300           1.10
19 Jan 2011  0.93       2.63    1.22      318           1.01
|
|
Copyright data kindly supplied by Environment Agency of
daily river levels 2003-2011 from monitoring stations shown.
|
             mAW         mAW    mAW                     mAW
   Date      Gillingham Hammoon Blandford Bear Mead     Wimborne
06Oct2003                       0.318     110
22Sep2005               0.106             120
14Sep2007    0.283                        142
|
|
Compiled, formatted, hyperlinked, encoded,
and copyright © 2011, John Palmer,
 All Rights Reserved. All Rights Reserved.
|