Updated 02 Apr 2016
|
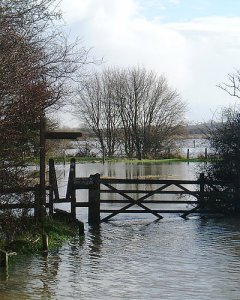
Flooding on the Dorset Stour at Bear Mead
|
|
Flooding on the Dorset Stour at Bear Mead.
|
|
To see author's latest PREDICTION for river PEAK
at BEAR MEAD,
go to Twitter
and look for #DorsetStourPeak.
|
This private website gives measured river and groundwater levels,
together with expected arrival time at Bear Mead, of any sizeable
rain-surge coming downstream.
Compiled by the landowner at Bear Mead  . .
Bear Mead
is located 1.5 miles upstream of Wimborne Minster
on the South Bank of the Dorset Stour, immediately West of
Eye Mead (National Trust) and North of the A31. It is a
private Nature Reserve of 25 acres, 5 hedged pasture fields
of flat flood plain with an oak and willow plantation.
It partly floods when the river height is greater than 350.
|
|
1 River and Groundwater levels
2 Estimation of river level
3 Estimation of surge delays
4 Records of heights and delays
5 Past floods and statistics
6 Panorama of flooded fields
7 Example of predicting
8 Past calculations
9 Twitter formats
10 Emails
11 Daily records since 2003
12 Library of Peaks since 2011
13
Jetstream 1
14
Jetstream 2
15
Twitter (use #dorsetstour)
|
Environment Agency websites: |
| | | | | | | |
 |
RIVER is the 70 mile Dorset Stour, the
depth is
measured
at Bear Mead 50 miles from the source.
|
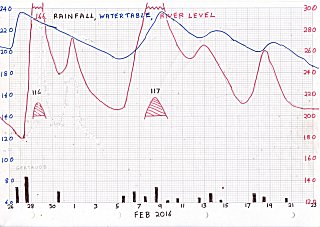
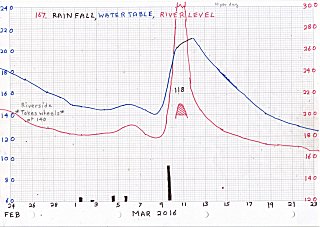
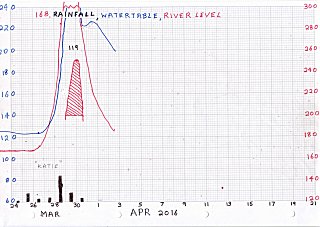
1. River and groundwater
levels.
|
GROUNDWATER is measured in a well
in the floodplain 223 yards from the river.
|
 |
26 Jan - 23 Feb 2016
 |
24 Feb - 23 Mar 2016
 |
24 Mar - 21 Apr 2016
 |
|
Bear Mead Nature Reserve is
closed
to wheeled traffic when the groundwater level is
above 170,
due to soft ground.
Always use the perimeter track, not the open fields.
|
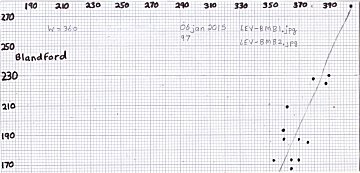
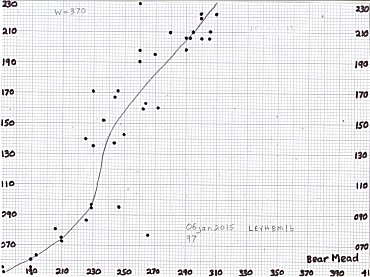
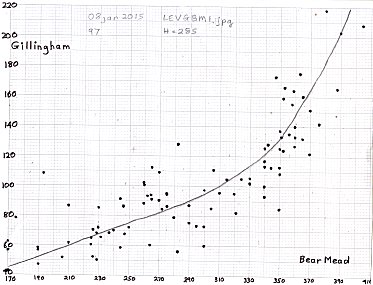
2. Estimation of River Level and Delay at Bear Mead |
When the floodplain is flooded or very wet, it may not
be possible to reach the river to read the level. In this case,
the Bearmead level can be estimated by reading the peak at
Blandford from the Environment Agency website and using the (left) graph
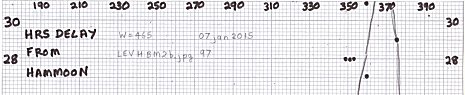
below. The delay is also very variable (depending on bottom smoothness from
previous peaks) and increases greatly as the floodplains are being filled.
Blandford to Bear Mead along river = 12 miles
|
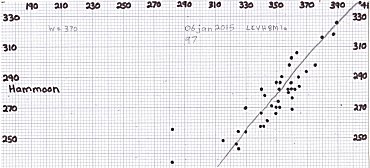
.......or the peak at
Hammoon and using the (left) graph below. The delay uses the right graph.
Hammoon to Bear Mead along river = 23 miles
|
.......or the peak at
Gillingham and using the (left) graph below. The delay uses the right graph.
Gillingham to Bear Mead along river = 44 miles
|
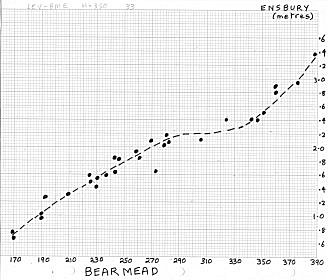
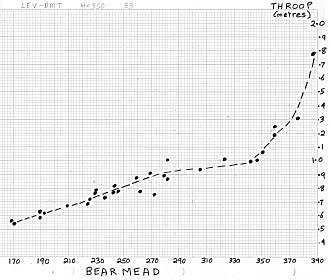
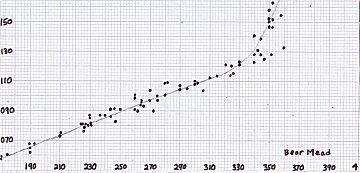
Height of peak at Bear Mead can be used to
estimate height of peak at Ensbury or Throop (but not Wimborne),
using these relation graphs.
|
Wimborne 3 miles (3 hrs average) downstream
- A Graph is not included because level readings for Wimborne
are not reliable.
- Movement of the sluice at Canford School affects level readings at
Wimborne Monitoring Station 0.5 miles upstream.
- The sluice is often adjusted by school staff near high water
to help remove snags caught in the weir. Graphs of over 10 examples
of this practice can be supplied on request.
- The sluice is also often adjusted at low water to normalize
river levels near the school.
|
Ensbury 10 miles (8 hrs average) downstream
|
Throop 13 miles (10 hrs average) downstream
|
|
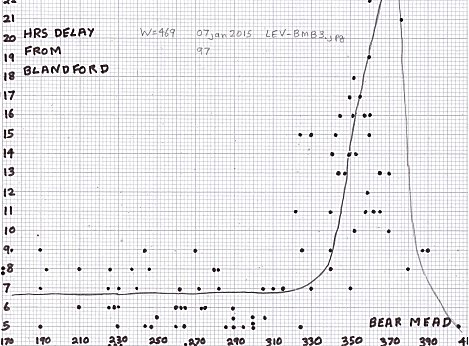
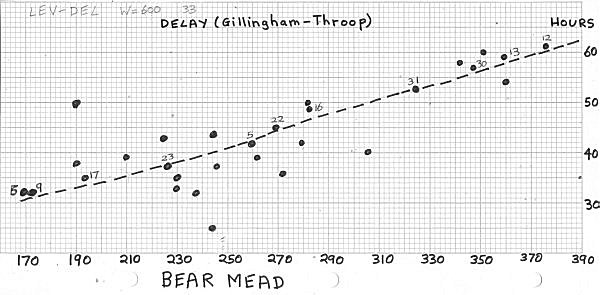
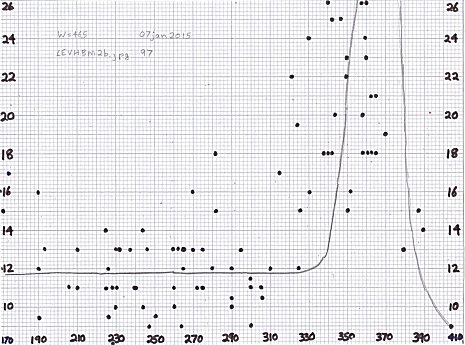
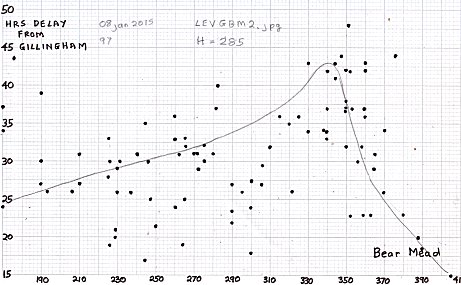
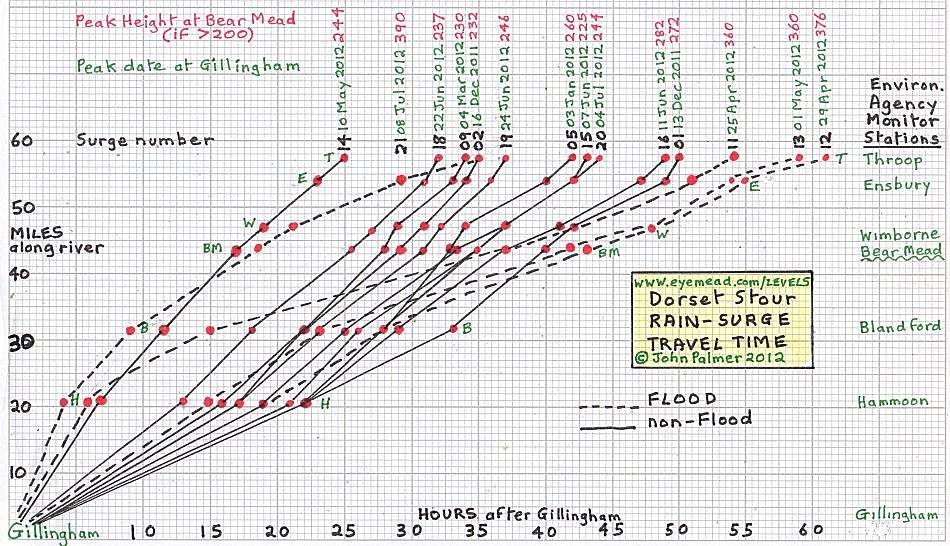
3. Estimation of rain-surge delay (between Gillingham and Throop).
|
Variation of total delay (in hours for Gillingham-Throop)
with peak at Bear Mead - Best fit wave numbers
|
Some records of peak arrival delays (relative to Gillingham)
on reaching Hammoon, Blandford, BEAR MEAD, Wimborne, Ensbury and Throop.
|
In the wet season (Nov-Apr), each rain surge downstream tends to
smooth the way for the next surge, shortening the overall river
travel time from Gillingham to Throop, and hastening its arrival at
Bear Mead. In Spring, new vegetation slows the surge. Uneven rain
distribution across the catchment area and
inputs from tributeries complicate any predictions. During a FLOOD,
the surge has to fill ever-increasing flood plains before advancing,
slowing the progress of the peak - Author
"Travel time in rivers is a combination of factors particularly the
roughness (Mannings n) which is a factor of vegetation growth etc...
The first event December 13th was the first big 'flush'
of the season. This is likely to have flushed away a lot of dead or
dying vegetation reducing frictional losses (Mannings n) shortening
the travel time."-Environment Agency
|
4. Records of peak heights and surge delays |
These records
are for obvious rain-surge peaks, from Monitor stations
at Gillingham, Hammoon, Blandford, Wimborne, Ensbury and Throop,
about
57 miles of the Dorset Stour. 150+ Environment Agency graphs, from
which these records are derived, are held for private use by the webmaster.
|
5. Past floods and statistics
|
Floods since July 03:
2003 none |
2004 none |
2005 Dec 3 |
2006 Nov 26, Dec 31 |
2007 Mar 6 |
2008 Jan 16, Mar 17, Dec 15 |
2009 Feb 10,
Nov 30, Dec 4, Dec 9 |
2010 none |
2011 none |
2012 Apr 27,
May 01, May 02, Jul 08
Nov 21,23,25,26, Dec 26 |
2013 Jan 14,29 Dec 26 |
2014 Jan 03, 06, 07, 09
|
| |
|
|
|
|
Floodplain state
|
0%
flooded
|
|
River temp: 4°C
River pH:
8.21
Last Flood: 9 Dec 2009
|
|
|
The river is over 72 miles from Source to Mouth.
The length of the Stour, along the river including all meanders,
was measured by using Google Earth with 'Tools-ruler-path'
facility, together with Philip's Street Atlas 3.5in=1mile.
The Stour rises at St Peters Pump, near Stourhead,
but can be under the surface for some distance in dry months.
It reaches the sea in Christchurch Harbour.
|
|
|
About the Dorset Stour
Length: 100km, Catchment area: 1,300km2,
Population: 400,000,
Rainfall: 697-1131 mms/year,
Flood season: Nov-Mar,
Land use: 8% urban, 52% arable, 34% grassland, 6% other.
Because much of the river's course is across clay soil, the river's
waterlevel varies greatly. In summer, low water level makes the river
a diverse and important habitat, supporting many rare plants.
In winter, the river often floods, and is therefore bordered by wide
and fertile flood plains. Eye Mead floodplain is pasture 1,000 metres wide,
and 19 metres above sea level.
|
When the River floods
Pictures of degrees of flooding at Eye Mead.
0% |
2% |
5% |
10% |
20% |
30% |
40% |
50% |
60% |
70% |
80% |
95% |
100% |
Bear Mead, 1km upstream (right), not visible to photograph.
Floodplain stretches 1km beyond (South) of River
|
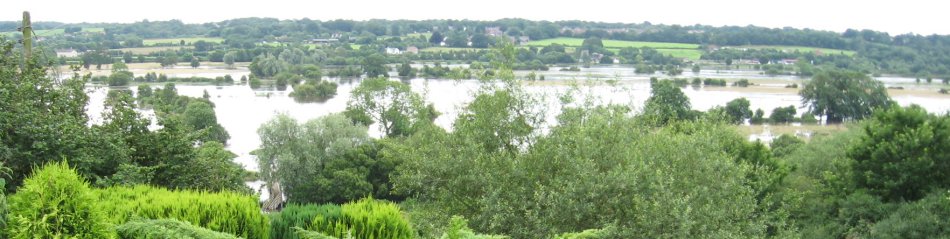
6. Panorama of flooded fields
|
The Dorset Stour floodplain, pictures centred on Eye Mead, SY 995-995,
Eye Bridge left foreground, (see flooding progress).
|
FL3224.
09 Jul 2012.
0900 hrs.
River height=390.
Fields 100% flooded.
(Very high summer flood, after 100mms rain in 7 days)
|
|
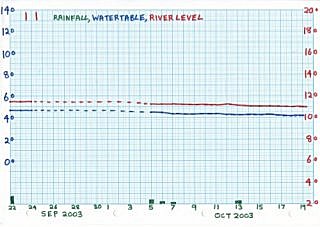
A record of the Rainfall, Watertable and River Level
of the River Stour at Bear Mead, about 2 miles West
of Wimborne Minster, Dorset. Contact the author at
 for more information. for more information.
|
This website tries to give simple answers to questions
about flooding on the Dorset Stour at Bear Mead.
- Where is Bear Mead?
See Location
- What do the fields look like when flooded?
See the pictures below
- How high does the watertable have to be before the fields flood?
220 cms
- How much rainfall is needed to make the river flood?
About 10 mms rain for every 10 cms below watertable of 220
- When is it likely to flood?
When the watertable is about 200 cms
(but depends how much rain arrives in next 36 hours)
|
- How quickly will it flood?
About 33 hours after heavy rain starts.
- How quickly will the flood disappear?
About 48 hours after heavy rain stops.
- How deep underground is the watertable?
(220-L) cms where L is the watertable level given above
- Are there past records for water levels?
Yes, see Numbers.
- Are there graphs of how past levels have changed?
Yes, see graphs.
- How has the river flow varied since 1968?
See Flow
|
State of Flooding on the River Stour
|
Bear Mead sometimes floods after prolongued rain in the winter.
The flood plain is 1200 yards wide at this point.
There are spot OS heights of 19 meters, in Field 3 and on the access
bridleway "D".
The nearest official calibrated river height scale is at Corfe Mullen Mill,
1.5 miles up stream, easily read from the A31.
There is a well in Field 5, enabling the water table to be monitored.
An unofficial scale has been placed in the river at Field 1.
Rainfall is monitored daily at the Author's home, 2 miles away.
The official calibrated river height scale at Julian's Bridge, Wimborne
showed 16.9 metres when the river at Bear Mead indicated 150 cms, so
Bear mead should flood when the official scale reads 18.6 metres
(assuming the weir near Eye Bridge has no effect).
Similarly, the scale at White Mill showed 21.4 metres, and should read
23.10 when Bear Mead floods.
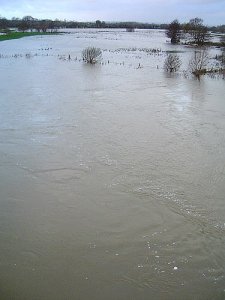
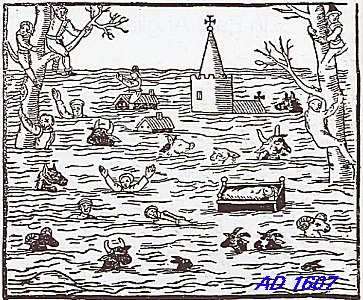
These pictures, taken in 2000, show what happens when the floodplain
floods. They were taken from Eye Bridge, because it is not possible
to get onto Bear Mead itself without a landing craft! The floods
usually arrive quickly but also depart quickly, leaving the ground
very soggy indeed. The depth of the water-table is a good measure
of the "sogginess".
|
6. The Stour and floodplain.
|
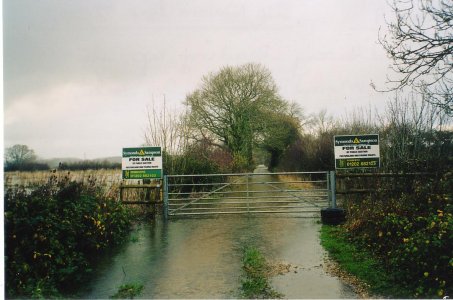
8. Approach bridleway to Bear Mead, 15 Nov 2002.
|
7. Car park at Eye Bridge
|
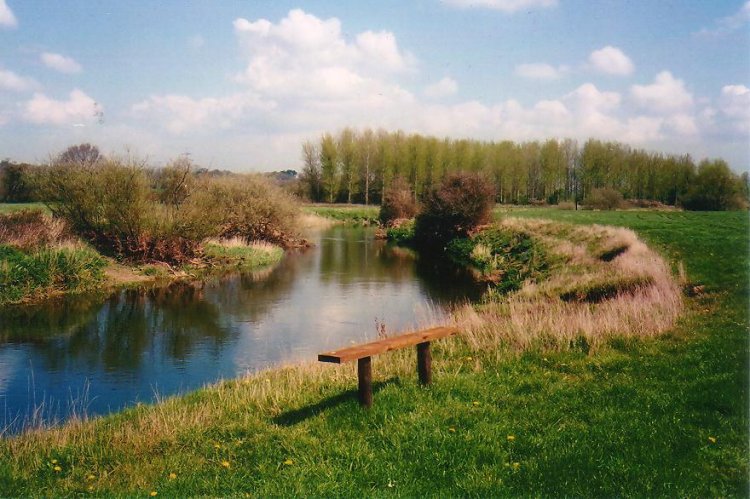
Bear Mead 14 Apr 2004
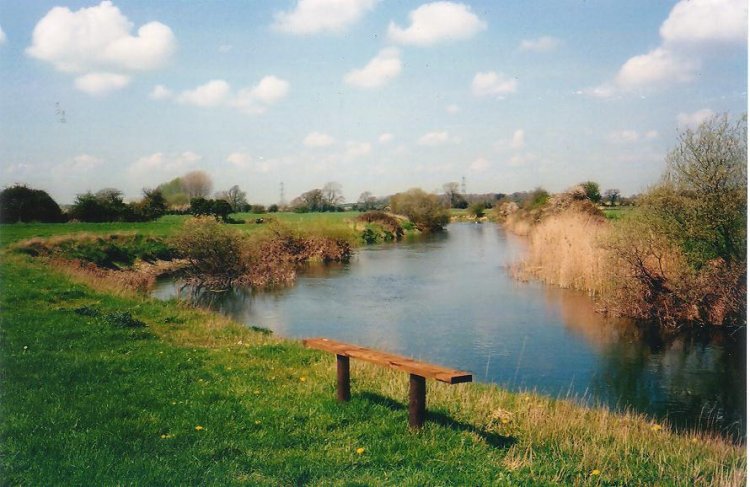
|
River Stour at normal height in Spring (145 cms)
|
26 Jun 2009. Thunderstorm over Poole, Dorset. 30mm rain in 9 hours
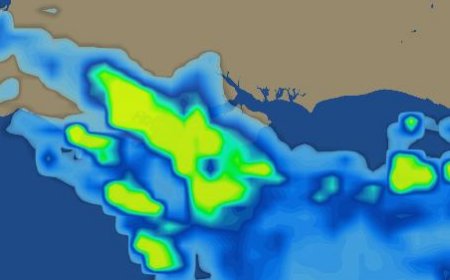
|
26 Jun 2009. Local rain runs into ditch then into river. Hump=250.
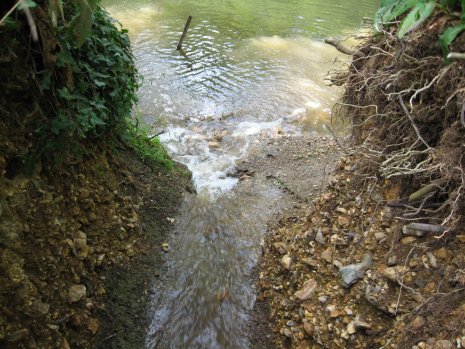
|
"It takes time for rain which falls over the catchment area to be converted into river flow and
any floodwater which builds up takes time to flow downstream to the sea".
SWGFL.
Bear Mead is 33 hours downstream of rain
Map of Catchment Area |
Recording Stations
|
Historic Flood Rainfall Figures:
Source: swgfl

Year Month Total Interval Max/Day
           (mm)  (Days)    (mm)
1894 Dec   141.1   7      36.0
1916 Nov   134.7   8      29.0
1916 Dec   104.0   6      44.0
1933 Feb    89.9   3      56.0
1943 Feb    94.2   8      26.0
1954 Dec    84.9   5      27.0
1966 Nov    68.8   4      56.9
1979 May   105.6  11      35.0
1979 Dec    86.1   5      57.8
1990 Feb    78.0   6      25.0
1999 Dec    90.9   6      30.5
2000 Oct    80.2   6      35.0

Floods recorded on this website:
2005 Dec    30     2      22
2006 Nov    54     4      21
2006 Dec    54     3      27
2007 Mar    53     4      19
2008 Jan    42     3      26
2008 Mar    26     3      16
2008 Dec    20     1      20
2009 Feb    40     2      28
2009 Nov    37     2      23
2009 Dec    38     2      22
|
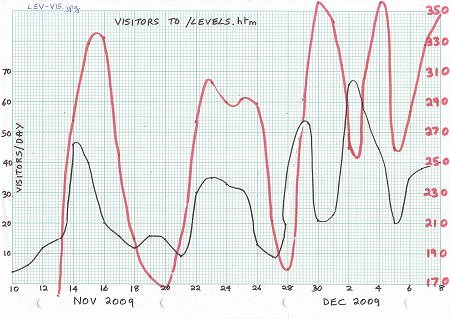
|
Nov-Dec 2009.
The number of visitors to this website follows quite closely
the height of the river, or perhaps my warning of a flood!
If you are one of these users, please email
and tell me your interest.
|
|
The river is over 72 miles from Source to Mouth.
The length of the Stour, along the river including all meanders,
was measured by using Google Earth with 'Tools-ruler-path'
facility, together with Philip's Street Atlas 3.5in=1mile.
The Stour rises at St Peters Pump, near Stourhead,
but can be under the surface for some distance in dry months.
It reaches the sea in Christchurch Harbour.
|
|
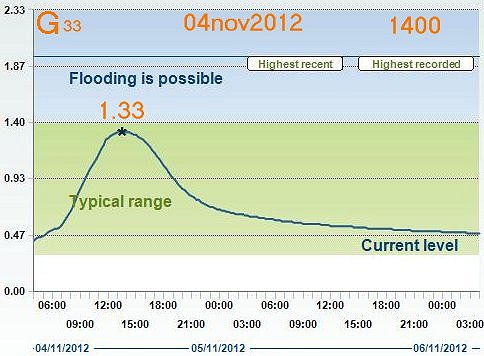
7. Example of predicting level and delay
|
|
METHOD.
From graph at 7
Peak of 1.33 at Gillingham at 1400 on 04nov2012
From graph at 2
Peak of 1.33 at Gillingham → expected level at Bear Mead of 344
From graph at 3
Peak of 344 at Bear Mead → expected total delay 57 hours, best fit Wave 30
From Table at 4
Wave 30 → Total delay Gillingham to Bear Mead = 44 hours
Predicted for Bear Mead: Level = 344, Arrival = 1000 06nov2012
(better predictions using Hammoon or Blandford but shorter delays)
Predicted for Ensbury: Level=2.40, Arrival=2200 06nov2012
Predicted for Throop: Level=1.00, Arrival=2300 06nov2012
RESULT.
Measured for Bear Mead: Level=351, Arrival=1400 06nov2012
Measured for Ensbury: Level=2.50, Arrival=0100 07nov2012
Measured for Throop: Level=1.06, Arrival=0200 07nov2012
|
Wave
33
35
|
Gillingham graph
1.33-1400-04nov2012
1.64-1600-21nov2012
|
Graph 2
1.33-344
1.64-370
|
Graph 3
344-57-30
370-60-13
|
Table
30-44
13-43
|
Bear Mead
344-1000-06nov2012
370-1100-23nov2012
|
Dorset Stour Prediction:
at 2000 14dec2012 Wave 39
using Gillingham data:
Bear Mead peak=295
at 2200 15dec2012.
Watch this space.
|
Dorset Stour Hindsight at 1500 27dec2012/
Wave 42 PEAKS/
Dec24 Gil 1600/Ham 1200/Bla 1800/
BearMead 1000/
Wim 1500/Ens 2300/Thr 0200 Dec27
|
----Anyone with more details for publication on this webpage,
please email ----
--------------------------------
Dear John
Thank you for your positive feedback on our river levels service and
sharing the link to your web page. I am pleased that you find our river
levels pages useful. I will be sharing this with our local operational
staff who maintain the local monitoring stations in Dorset and others
who help ensure this information is published. I know they appreciate
seeing this type of feedback.
Kind regards
Simon Wood
Team Leader Hydrometric Data
Hydrometry & Telemetry Monitoring
National Monitoring Service
Head Office Operations
---------------------------------
Good Afternoon John,
Many thanks for your comments regarding the online River and Sea levels
Service, I have forwarded the feedback to our contact for the online
service. If you need anything else please get in touch on 03708 506 506,
we will be more than happy to help.
Best Regards,
Alexander Haigh
Duty of Care Team & Hazardous Waste Team
Part of National Operations
Environment Agency
---------------------------------
Hello,
I would like to thank the Environment Agency for placing their River Level
graphs online. I have kept a close watch on my local River (the Dorset Stour)
for 12 months now, and recorded 39 significant peaks travelling between
Gillingham and Throop, their height and travel times over 57 miles. My
reading of these graphs has been placed online at
www.eyemead.com/LEV-LIBR.htm, together with my own graphs of daily readings
of river height and groundwater height at Bear Mead near Wimborne. This
has enabled me to get a good feeling for what my local river is likely to do,
and when. I hope those living near a large river will make a similar use of
your excellent online facilities.
Many thanks,
John Palmer, Broadstone, Dorset
----------------------------------
|
|
Max   270-410
      EB  R
10feb 290 302
23jan 294 302
11jan 270 286
--------------
31dec 303 319
26dec 338 360
22dec 291 305
20dec 330 348
19dec 282 292
17dec 304 319
|
Compiled, formatted, hyperlinked, hand-coded,
and copyright © 2004, John Palmer,
All Rights Reserved.
|