Updated 05 Jul 2012
|
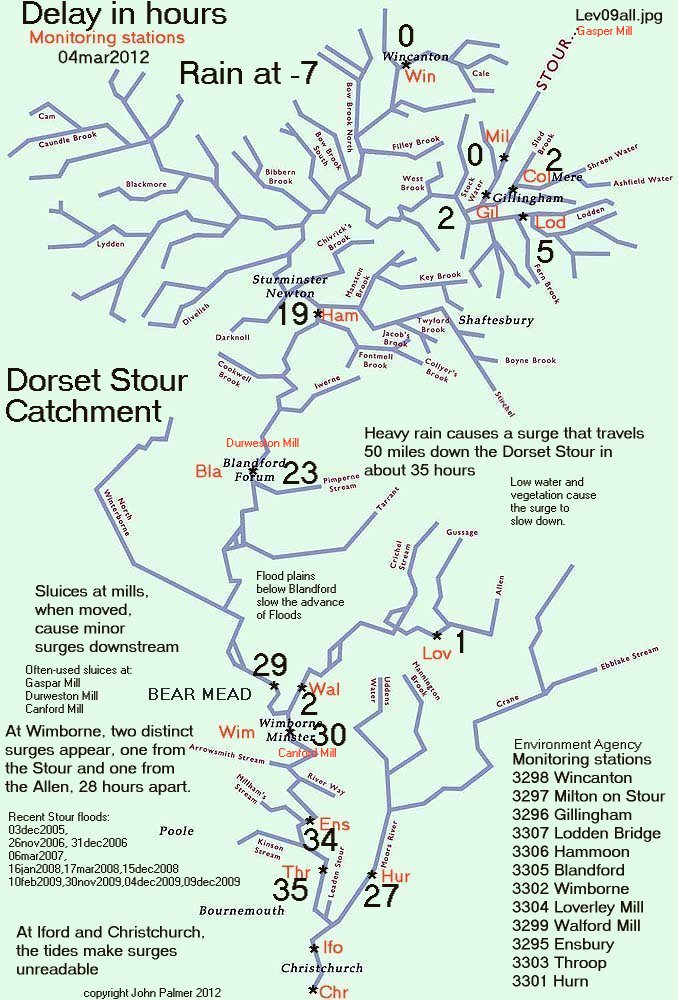
Dorset Stour - Surge Travel Times
|
|
Flooding on Dorset Stour - Surge Travel Times.
|
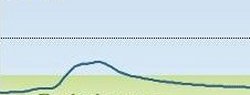
"Tidal Wave" (caused by heavy rain) progressing
60 miles down the Dorset Stour in 35 hours through
Milton-Gillingham-Hammoon-Blandford-
Bear Mead-Wimborne-Ensbury-Throop
|
Remove cattle and sheep from Eyemead, phone ****
See also
Dorset Stour Catchment Flood Management Plan
by Environment Agency (Summary Report December 2009)
Locations:
Colesbrook (ST 807 278) | Hammoon (ST 820 147) |
Loverley (SU 006 085) | Walford (SU 008 007) |
Throop (SZ 113 958) | Hurn Court (SZ 126 969) |
|
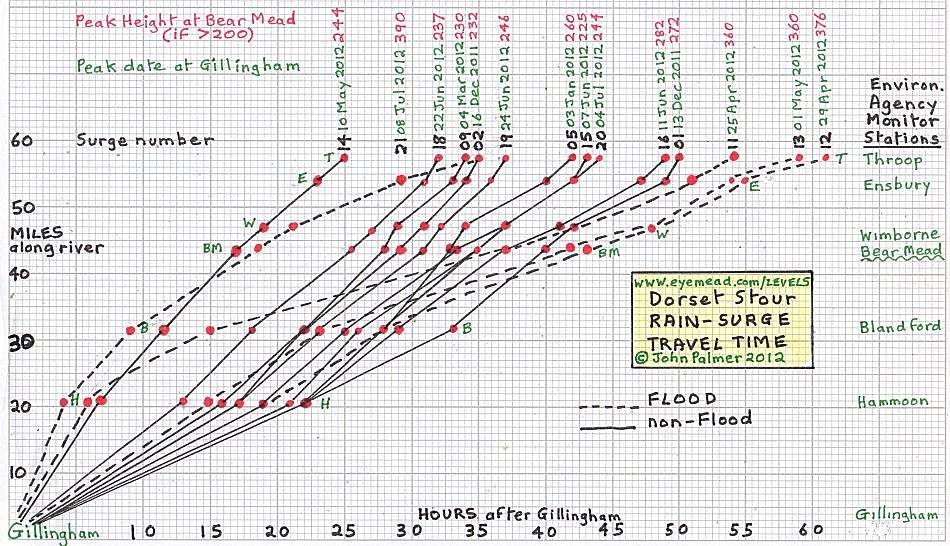
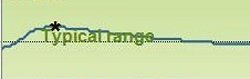
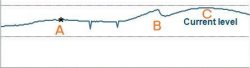
The spread of travel times along the Dorset Stour.
Moving peaks are first seen at
Gillingham.
Environment Agency advise:"Travel time in rivers is a
combination of factors particularly the roughness
(Mannings n)
which is a factor of vegetation growth etc... The first event
December 13th was the first big 'flush' of the season. This
is likely to have flushed away a lot of dead or dying
vegetation reducing frictional losses
(Mannings n)
shortening the travel time."
|
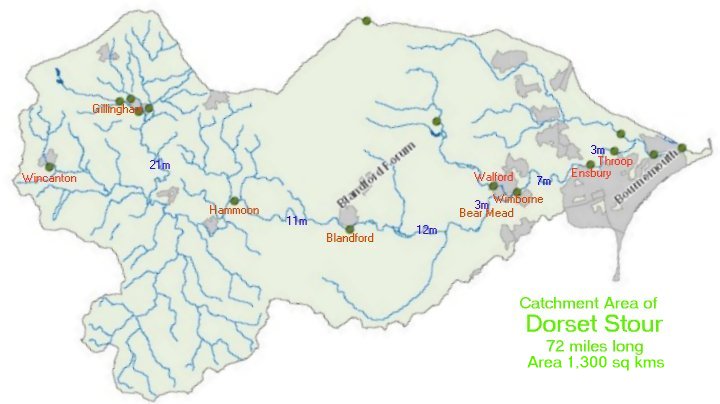
Recording Stations along Dorset Stour
(run by Environment Agency) used in this report.
 |
|
Manning's formula for Stream Flow
|
V= n-1R2/3S1/2
|
V=mean velocity of flow, (metres per sec).
n=Mannings coefficient of roughness.
R=hydraulic radius (metres).
S=slope of energy grade line (metres per metre).
|
H=river height above AOD in metres.
dH=fall along a section in metres.
D=distance along river in kms.
dT=travel time of peak along the section in hrs.
|
Section      H         dH     D kms   dT  V     S       R
Gillingham   68.11
                      27.21   34.0   23   0.41  1249    3.2
Hammoon      40.9
                       9.9    17.32  10   0.48  1749    8.5
Blandford    31
                      13.0    19.18   8   0.67  1475   13.5
Bear Mead    18
                       3.39    5.2    2   0.72  1534    9.2
Wimborne     14.61
                       4.61   11.14   6   0.52  2416   10.5
Ensbury      10
                       5.0     5.46   1                13.8
Throop        5
            ------    -----   -----  ---  ----  ----   ----
                      63.11   92.30  50   0.51  1462   10.5
|
|
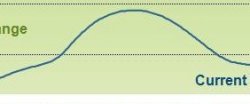
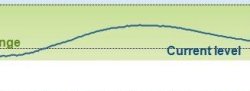
- Get time and height of a significant surge peak from
Environment Agency website for Gillingham
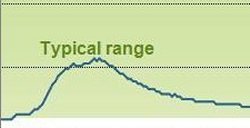
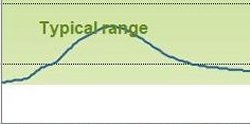
- Choose a curve from Travel Times graph
which matches the new surge peak, based on:
Height of peak at Gillingham | Time before last good rainfall |
Season of year (vegetation) | Suddenness of rain | Direction of rain.
|
- Apply delays on chosen curve
to places downstream: Hammoon-Throop to make prediction.
- Follow the surge downstream using the
EA website to correct and update your predictions.
|
      STOUR peak heights (metres) & surge delays (hours)
2011 13dec 16dec 31dec 01jan 03jan 24jan 05feb 10feb 04mar
Place 01    02    03    04    05    06    07    08    09
Gill 1.28  0.72  0.58  0.52  1.02  0.56  0.42  0.39  0.75
      22    16    18    15    22    19    12    18    16
Hamm 2.56  1.71  0.52  0.81  2.30  0.55  0.52  0.46  1.51
      11     6     5     6     6     7     4     5     5
Blan 1.09  0.87  0.65  0.71  1.01  0.59  0.85  0.52  0.57
       7     7     7     5     5     8     6     6     8
BM    282   230   190    ?    260   170   230    ?   170
       2     2     2     1     1     2     1     2     3
Wimb 0.96  0.76  0.72  0.75  0.96  0.66  0.76  0.61  0.65
       7     3     3     5     6     2     4     6     2
Ensb 2.07  1.55  1.00  1.13  1.93  0.75  1.41  0.55  0.69
       1     1     3     1     2     2     1     1     3
Thro 0.91  0.78  0.63  0.67  0.87  0.56  0.75  0.52  0.56
Tot  [50]  [35]  [38]  [33]  [42]  [32]  [33]  [38]  [32]
|
      STOUR peak heights (metres) and surge delays (hours)
 25apr 29apr 01may 10may 07jun 11jun 15jun 22jun 24jun 2012
  11    12    13    14    15    16    17    18    19   Place
 1.33* 1.42* 1.40* 0.58  0.65  0.56  1.08  0.68  0.86  Gill
   6    15    19     7    19    22    13    13    17
 3.02* 2.98* 2.82* 1.37  1.39  2.34  0.63  1.51  1.71  Hamm
   9     8     9     5     6     7     5     5     5
 1.87* 1.85* 1.47* 0.86  0.81  1.09  0.68  0.87  0.92  Blan
  22    21    15     5     6     8     8     8     8
  360*  376*  360*  244   225   282   193   237   246  BM
   5     4     5     2     4     4     4     1     2
 1.34* 1.40* 1.26* 0.84  0.80  0.94  0.70  0.84  0.90  Wimb
   9     7     6     4     5     6     4     4     4
 2.88* 2.95* 2.80* 1.63  1.59  2.18  1.26  1.60  1.85  Ensb
   3     6     5     2     1     2     1     1     1
 1.25* 1.31* 1.19* 0.82  0.69  0.87  0.62  0.73  0.77  Thro
 [54]  [61]  [59]  [25]  [43]  [49]  [35]  [32]  [37]  Tot
|
      STOUR peak heights (metres) & surge delays (hours)
2012 04jul
Place 20    21    22    23    24    25    26    27    28
Gill 0.91
      21
Hamm 1.67
       5
Blan 0.91
       9
BM   244
       2
Wimb 0.90
       5
Ensb 1.87
       2
Thro 0.76
Tot  [44]  [  ]  [  ]  [  ]  [  ]  [  ]  [  ]  [  ]  [  ]
|
      STOUR peak heights (metres) and surge delays (hours)
                                                       2012
  31    32    33    34    35    36    37    38    39   Place
                                                       Gill

                                                       Hamm

                                                       Blan

                                                       BM

                                                       Wimb

                                                       Ensb

                                                       Thro
 [  ]  [  ]  [  ]  [  ]  [  ]  [  ]  [  ]  [  ]  [  ]  Tot
|
|
Compiled, formatted, hyperlinked, encoded,
and copyright © 2011, John Palmer,
 All Rights Reserved. All Rights Reserved.
|