Updated 04 Jan 2014
|
Flooding on Dorset Stour - Averages
|
|
Flooding on Dorset Stour - Averages.
|
This page shows monthly and yearly average RAINFALL and WATERTABLE
for Bear Mead.
Also an estimated
RIVER FLOW RATE for a range of river heights,
MASS TRANSPORT caused by rain, and
pH readings.
Location of Bear Mead:
2,100 metres upstream of Julians Bridge, Wimborne Minster, Dorset, UK.
and 1,090 metres upstream of Eyebridge.
|
Have a look at the following: |
|
|
|
|
Note:
The 2 month delay between rainfall and watertable maxima.
Flood season covers Nov-Mar
6 of 11 floods occured Nov 26-Dec 15.
The high July watertable average, caused by a very wet '07 and '08
|
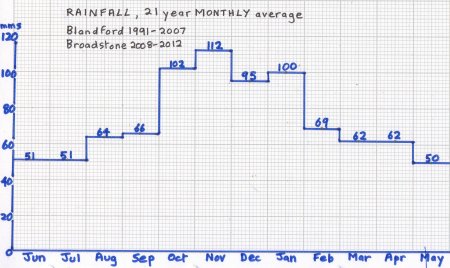 |
                                Rainfall in Dorset (mms per month)
    2000 2001 2002 2003 2004 2005 2006 2007 2008 2009 2010 2011 2012 2013 2014 Av
Jan   44  108   98  124  128   55   26  161  133   99   72  106   47  120      98
Feb   94   83  111   41   50   18   59  105   49   92   89   84   21   48      66
Mar   46  146   56   43   51   47   77   75  102   26   80   18   33  100      62
Apr  152   88   54   52   80   69   24    4   76   51   34    4  139   58      65
May   64   22  107   44   37   31  101  111   91   25   13   32   65   54      51
Jun   21   21   35   47   44   33   24  109   51   68   38   98  160   25      55
Jul   54   64   49   50   45   60   40  132   82   80   28   33  132   32      53
Aug   41   23   36   14   86   59   52   86  119   52  109  123   67   28      63
Sep  111   59   49    5   50   26   45   32   75   23   24   58   92   42      66
Oct  173  168  167   82  177  129  145   36  100   92   37   58  169  141     107
Nov  167   44  220  125   25   81  153  115   82  196  110   49  151   61     111
Dec  164   26  139   74   61   89   84   96   22  150   61   92  176  213     104
Tot 1131  852 1121  701  834  697  830 1062  982  954  695  755 1252  922     902
(Data derived from that supplied by Environmental Agency for Rivers House,
 Blandford, 1991-2007, for 2008-2013 on from Author's measurements at Broadstone)
|
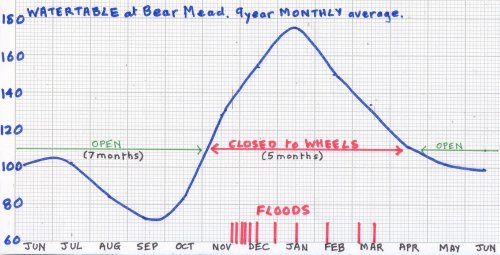
  Watertable at Bear Mead, Dorset
      Average cms above datum
    '03 '04 '05 '06 '07 '08 '09 '10 '11 '12 Average
Jan   - 172 129 114 202 185 159 184 178     165
Feb   - 140 110 116 179 163 181 164 144     150
Mar   - 133  86 114 164 152 145 174 107     134
Apr   - 134 100 107 108 123  92 146  81     111
May   - 115  89 104 117 133  96  91  70     102
Jun   -  93  92 107 116 143  97  77  65      99
Jul   -  95  84  97 162 150  95  70  62     102
Aug  55  82  71  72 119 107 104  69  73      84
Sep  49  77  51  59  88 102  72  73  80      72
Oct  48 130  65  86  81 108  68  90  68      83
Nov 104 121 123 142 114 181 176 120  74     128
Dec 158 125 144 194 175 158 211 113 110     154
(Data measured by author at Bear Mead)
|
River Flow rate at Bear Mead |
Water speed measured by timing an orange to travel the drift line
(about 167 metres). (This method does not work in summer with river <200
because of weed).
Drift length and river width measured using Google Earth.
Depth measured using a kayaker with a pole with scale to sound the river
in several places.
Centre of picture is at O.S. ref: SY 989-994
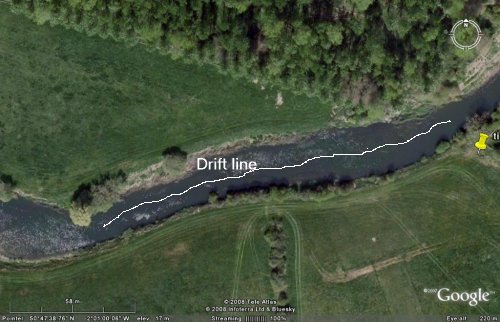
North shore 164.64 metres,
Centre line 167.08,
South shore 170.76,
Average width 21.62,
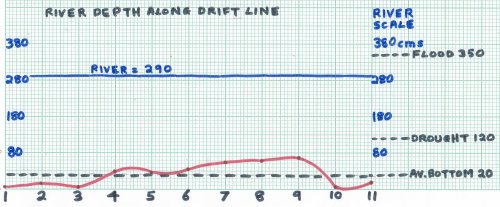
Average depth 2.70 at River=290
(measured by Warren in a red kayak)
Volume 167.08 x 21.62 x 2.70= 9,753 cu metres
for river=290.
Floods when river height=350 when flow rate=80 cu m/sec=80 tonnes/sec
|
River Flow readings |
Estimated Flow rate in cubic metres/second for different
river heights.
Flow rate=[167.08x21.62x (height-0.2)]/time.
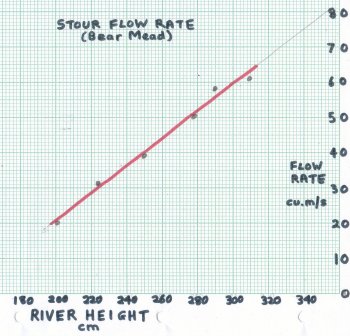
        River   Drift   Water   Flow
 Date    Height  Time    Speed   Rate
 2008    cms     secs    m/sec   cu m/sec
4 Jun 290 180 0.93 58
5 Jun 224 260 0.64 31
6 Jun 201 360 0.46 20
10 Jul 278 202 0.83 50
11 Jul 310 180 0.93 62
12 Jul 250 240 0.70 38
13 Jul 213 316 0.53 24
2012
13 Oct 347 200 1.39 98
|
|
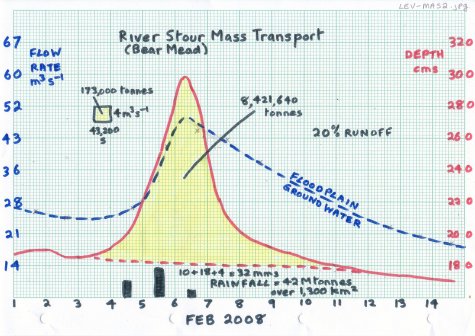
On 4-5-6 February 2008, 32 mms of rain fell on the 1,300 sq km Stour
catchment area in 48 hours, a total of 42 million tonnes.
About 20% became surface runoff, causing an increase in the river flow
rate (highlighted), estimated at transporting an extra 8.4 million
tonnes in 6 days. A peak of 3.4 million tonnes was reached on the third
day after the rain.
About 80% soaked into the ground, causing the groundwater level to rise
by an average of 2.56 cms. This stored rainwater would return to the river
by seepage over a period of months or years, or be reduced by evaporation
or transpiration during the remaining summer.
In the floodplains, the groundwater rose by 55 cms before seepage
caused it to return to its previous value in about 7 days.
 |
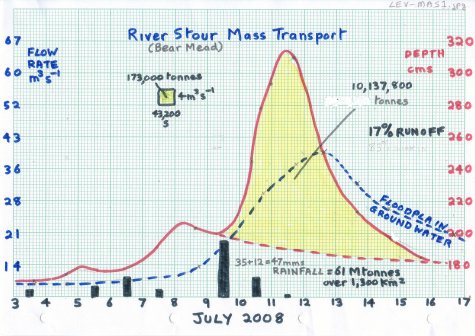
On 9th and 10th July 2008, 47 mms of rain fell on the 1,300 sq km Stour
catchment area in 24 hours, a total of 61 million tonnes.
About 17% became surface runoff, causing an increase in the river flow
rate (highlighted), estimated at transporting an extra 10 million
tonnes in 5 days. A peak of 4 million tonnes was reached on the second
day after the rain.
About 83% soaked into the ground, causing the groundwater level to rise
by an average of 3.9 cms. This stored rainwater would return to the river
by seepage over a period of months or years, or be reduced by evaporation
or transpiration during the remaining summer.
In the floodplains, the groundwater rose by 80 cms before seepage
caused it to return to its previous value in about 7 days.
 |
Comments on pH
Pure, distilled water has a pH value of 7.0.
Stream water usually ranges from pH 6.5 (slightly acidic) to a pH of 8.5,
an optimal range for most organisms.
Rain water by contrast is naturally acidic at about 5.6.
The pH of a stream affects the organisms living there.
The optimum for most is between 7 and 8 and aquatic insects 4-5.
Acid rain, from car exhaust or coal-fired power stations, causes a drop
in the pH of water.
Pollution from accidental spills, agricultural runoff and sewer overflows
can also change the pH.
Buffering capacity is water's ability to resist changes in pH, and is
critical to the survival of aquatic life.
Limestone soils act to neutralize acidity and often result in a more
basic pH.
While young fish and insect larvae are sensitive to a low pH (acid),
extreme values on either end of the scale can be lethal to most organisms.
The type of geology and soil that the water is flowing over affects pH, e.g.
chalk soil makes the result slightly alkaline and clay soil slightly acidic.
A river flowing through chalky soil results in the pH level being about
pH 8, very slightly alkaline pH is also affected by photosynthesis of
algae and other plants in summer.
pH declines gradually in response to higher rainfall and increased total
annual discharge.
Rivers flowing through agricultural areas carry increased sediment loads,
have elevated temperatures, pH and PO4 concentrations, and lower oxygen.
Macroinvertebrate communities vary according to land use and are most
severely impacted downstream on towns.
           THE pH SCALE
Higher numbers indicate alkalis,
lower values signify acidic liquids:
13 - bleach
10 - soap
8.2 - pre-1750 oceans (average)
8.1 - current oceans (average)
7.8 - oceans in 2100 (projected average)
7 - pure water
3 - vinegar
0 - battery acid
(Source: NMEA)
|
Response time of sources to rain is: River 33 hours,
Well 10 hours, Millstream 3 hours, and Scrape 0 hours
                            pH Readings
Rain  Date   Buffer  River  Outflow  Well  MStream  Scrape  Tapwater  Rainwater
 0    17 Jun  -       -       -       -     -        -      7.13       -
 0    18 Jun  -      8.29     -      7.84   -        -       -         -
 2    19 Jun  -       -       -       -     -        -       -         -
 1    20 Jun 6.87    8.29     -      8.12  8.52      -       -         -
 7    21 Jun  -       -       -       -     -        -       -        5.35
 0    22 Jun 6.88    8.26     -      8.35  7.88     7.34     -         -
 0    23 Jun 6.88    8.41    8.43    8.09  7.83     7.24     -         -
 0    26 Jun 6.85    8.59    8.50    8.29  8.31     7.15     -         -
 4    03 Aug 6.87    8.21     -      7.51  7.04     7.18     -        5.34
|
|
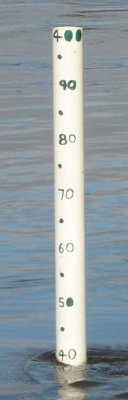
Level Calibration near Flood
|
Main
12 Nov 2008
1250 hrs
Lev=344
0
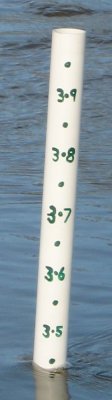
Min=110
|
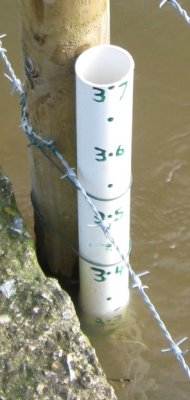
Repeater
12 Nov 2008
1250 hrs
Lev=338
-6
Min=
|
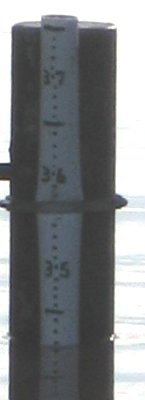
Mill Stream
12 Nov 2008
1300 hrs
Lev=332
-12
Min=245
|
Eyebridge
12 Nov 2008
1322 hrs
Lev=342
-2
Min=275
|
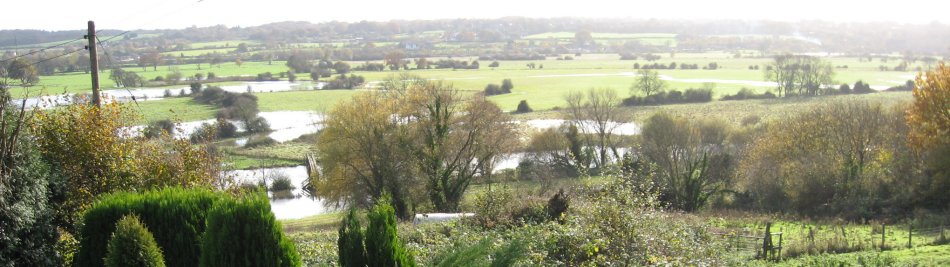
Pamphill Green viewpoint, 12 Nov 2008, 1325 hrs, Lev=344, 30% flooded
|
Compiled, formatted, hyperlinked, encoded,
and copyright © 2008, John Palmer,
 All Rights Reserved. All Rights Reserved.
|