Updated 11 Aug 2012
|
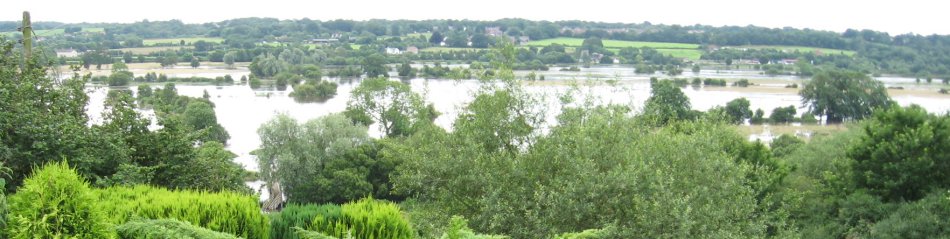
Flood on Dorset Stour 09 Jul 2012
|
|
Flood on Dorset Stour 09 Jul 2012.
|
The average rainfall in Dorset for
June 1991-2011 was 51 mms.
Between 04 June - 08 July 2012 Dorset experienced 281 mms in 34 days,
an increase to 550%.
This caused a flood of the Dorset Stour 08-10 July,
"higher than any recorded before" (average 106%)
at 9 of 11 monitoring stations
run by the Environment Agency on that 70 mile river.
Statistics
made public online by E.A. are shown below, together with
graphs of river levels permitted by E.A.
The direct cause of this increase is a move of the summer
jetstream
over the UK from North of Scotland to over Spain, allowing a series
of low pressure areas to pass over England.
Something similar happened in 2007.
Rain surges #15 to #20 passed
down the Stour between Gillingham and Throop, followed by #21 on 08jul2012
which produced the unusually high flood. At Bear Mead, the
flood plain stretches
800 metres South of river and 1000 metres North. Most of this is rated
at 1 in 100 chance of flooding each year by Environment Agency. 60 hours
after a peak of about 390, the river level at Bear Mead was down to 240,
and most of the surface water had drained away or was hidden in the
dense well-watered summer vegetation, leaving a cloud of summer brown
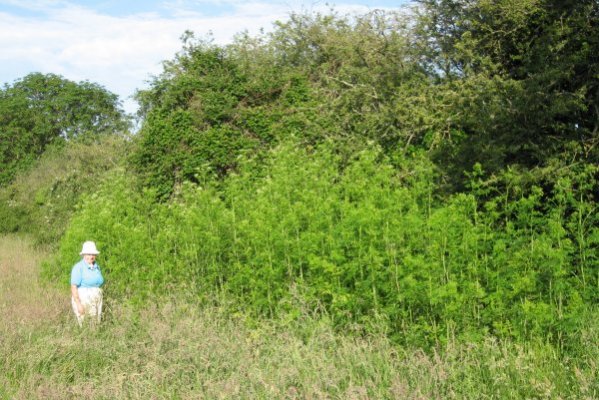
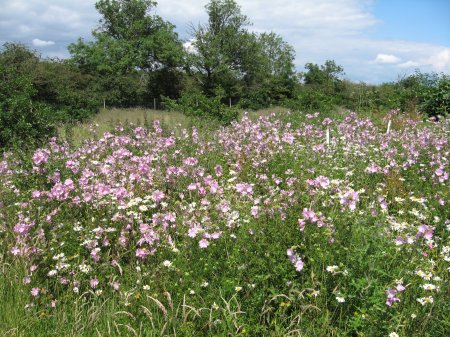
butterflies fluttering in the sunshine. The increased rainfall in summer
also caused overgrowth of grass, nettles and plants
like poison hemlock, musk mallow and oxeye daisy.
|
1. The jet stream has shifted further south than usual,
bringing wet and windy weather to the south of the country,
making summer 2012 similar to summer 2007.
 See
Jetstream forecast for 16 days
See
Jetstream forecast for 16 days
|
The Dorset Stour floodplain, pictures centred on Eye Mead, SY 995-995,
Eye Bridge left foreground,
(see degrees of Flood).
|
FL3224.
09 Jul 2012.
0900 hrs.
River height=390.
Fields 100% flooded.
(Very high summer flood, after 100mms rain in 7 days)
|
|
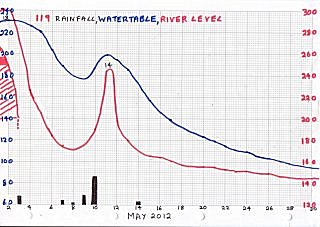
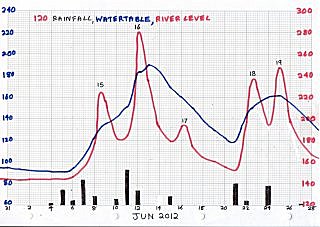
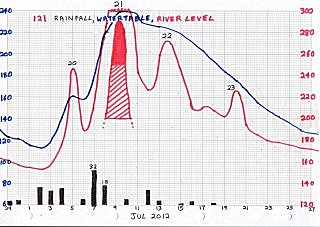
3. Rainfall, river and groundwater levels at Bear Mead 2012
|
See also 2007
|
02 May 2012 - 30 May 2012
-14
 |
31 May 2012 - 28 Jun 2012
 |
29 Jun - 27 Jul 2012
123456789012
FLOOD-15
 |
|
Rainfall measured near Bear Mead, in mms per 24 hours,
causing the river surges 14-23 shown above.
Surge 21 is the flood of 9 July 2012
shown below.
|
 Surge 14

03may  6.8
07may  3.5
08may  2
09may  9
10may 25.5
----- ----
11may 46.8
|
 Surge 15

04jun  2.5
05jun 14.5
06jun  3.6
07jun 23
08jun  8.5
----- ----
09jun 52.1
|
 Surge 16


10jun  5
11jun 33
----- ----
12jun 38
|
 Surge 17


12jun 13
15jun  7.5
----- ----
16jun 20.5
|
 Surge 18


18jun  1.5
21jun 19.3
22jun  3.5
----- ----
23jun 24.3
|
 Surge 19


24jun 18.5
----- ----
25jun 18.5
|
 Surge 20
27jun  1
29jun  2.8
30jun  2.9
02jul 16.4
03jul 12.7
04jul 15
----- ----
05jul 71.6
|
 Surge 21


06jul  5.5
07jul 32
08jul 18
----- ----
09jul 55.5
|
 Surge 22


10jul  4.5
12jul 14
13jul  3.5
----- ----
14jul 22
|
 Surge 23


15jul  1
16jul  3
----- ----
20jul  4
|
|
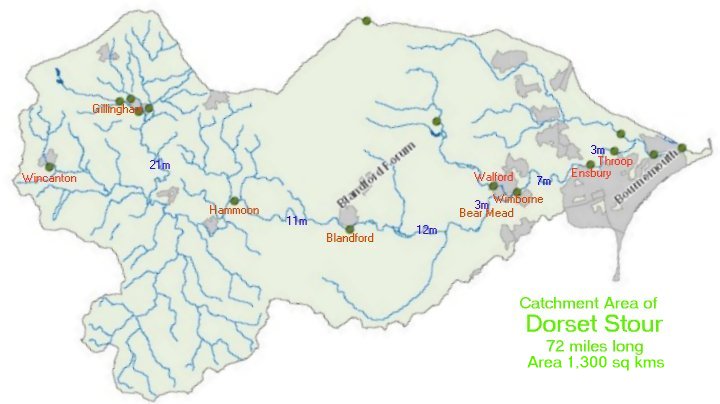
Monitor Stations along the Dorset Stour
(run by Environment Agency) used in this report.
See more details.
 |
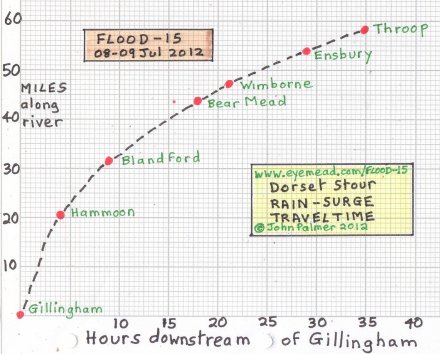
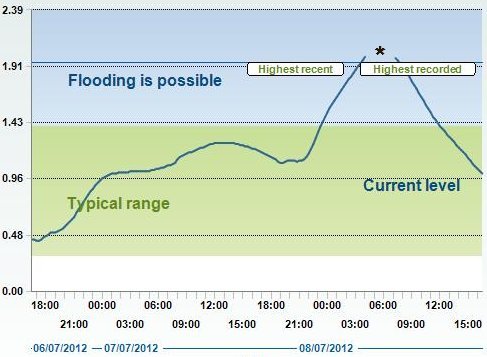
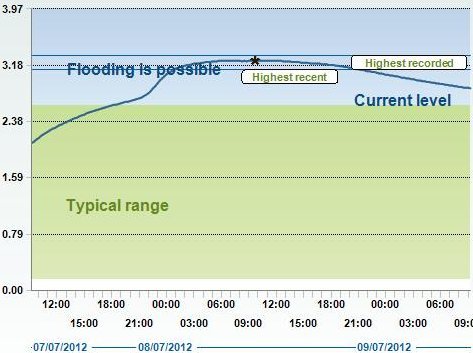
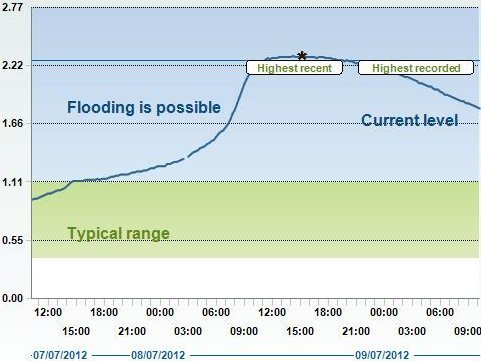
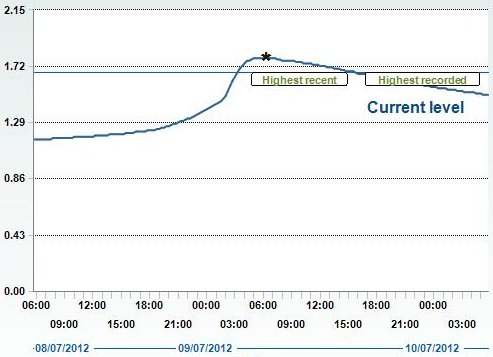
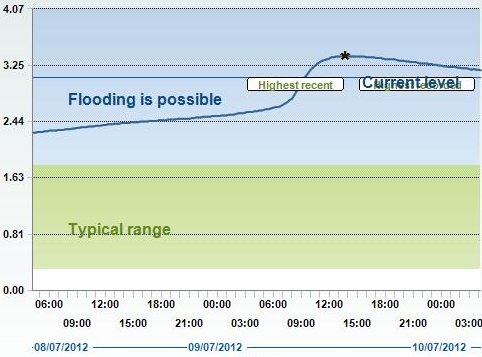
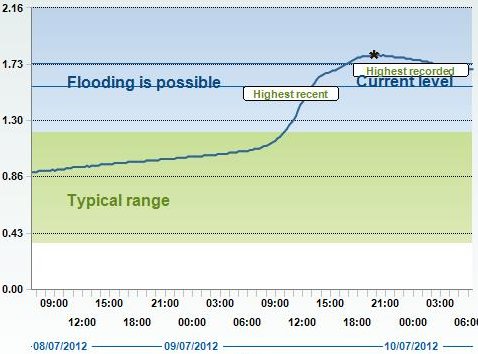
5. Flood progress along river |
These 6 graphs show the progress of the peak flood
along 57 miles of the Dorset Stour in 35 hours between
Gillingham and Throop,
as it passes by Monitor Stations run by the Environment Agency.
Each graph
"Contains Environment Agency information ©
Environment Agency and database right"
|
7.22
miles
to
source
|
Gillingham peak of 2.03 metres at 0600 hrs on 08jul2012
|
4
hrs
total
4
hours
delay
21.13
miles
21.13
total
1/1,250
gradient
|
Hammoon peak of 3.26 metres at 1000 hrs on 08jul2012
|
9
hrs
total
5
hours
delay
10.76
miles
31.89
total
1/1,749
gradient
|
Blandford peak of 2.30 metres at 1500 hrs on 08jul2012
|
18
hrs
total
9
hours
delay
11.92
miles
43.81
total
1/1,476
gradient
|
BM 21
High water
at
BEARMEAD
expected
0300 hrs
09jul2012
390?
|
21
hrs
total
3
hours
delay
3.23
miles
47.04
total
1/1,533
gradient
|
Wimborne peak of 1.78 metres at 0600 hrs on 09jul2012
|
29
hrs
total
8
hour
delay
6.92
miles
53.96
total
1/1,985
gradient
|
Ensbury peak of 3.37 metres at 1400 hrs on 09jul2012
|
35
hrs
total
6
hour
delay
3.39
miles
57.35
total
1/1,364
gradient
|
Throop peak of 1.79 metres at 2000 hrs on 09jul2012
|
7.38
miles
to
sea
|
|
|
|
                      FLOOD STATISTICS

     Monitor    Peak      Peak Peak  Previous       Site     Site River
ID   Location   Date      Time Meter Highest        Opened   AOD  Length Gradient
3298 Wincanton  08jul2012 0200 1.51  2.94 13dec2008 Jan 2004 67.5
3297 Milton     08jul2012 0200 1.03  1.03 09feb2009 Jan 2003  -
3308 Colesbrook 08jul2012 0500 1.65  1.58 09jul2009 Dec 1973 71.8 metres
3296 Gillingham 08jul2012 0600 2.03  1.95 10feb2009 Jan 1992 68.1 34,005 1/1,250
3307 Lodden     08jul2012 0600 2.95  3.46 10jan2007 Jan 1992 68
3306 Hammoon    08jul2012 1000 3.26  3.11 02dec2005 Mar 1968 40.9 17,317 1/1,749
3305 Blandford  08jul2012 1500 2.30  2.27 03dec2005 Jan 1991 31   19,183 1/1,476
---- BEAR MEAD  09jul2012 0300 3.90? 3.85 03dec2005 Aug 2003 18    5,198 1/1,533
3302 Wimborne   09jul2012 0600 1.78  1.67 03dec2005 Jan 1997 14.6 11,137 1/1,985
3295 Ensbury    09jul2012 1400 3.37  3.08 03dec2005 Jan 1992  9    5456  1/1,364
3303 Throop     09jul2012 2000 1.79  1.56 11feb2009 Jan 1973  5
3304 Loverly    08jul2012 1000 0.33  0.75 05dec2009 Jul 1973 37.3
3299 Walford    08jul2012 0800 0.40  0.60 11mar2007 Nov 1974 18.7
3301 Hurn       08jul2012 2100 1.21  1.38 10feb2009 Jun 1989  4.5
3300 Iford      10jul2012 0300 2.48  2.34 04dec2005 Jan 2006  -
Source: Environment Agency
|
|
|
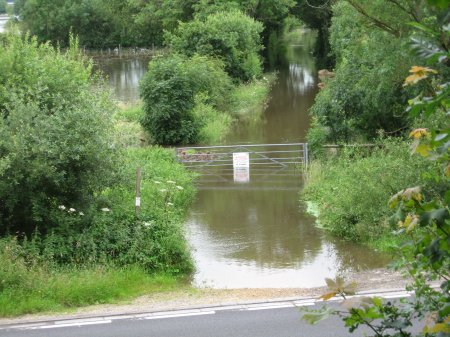
FL3220. Flooded bridleway to A31, 760 yards from river Stour.
 |
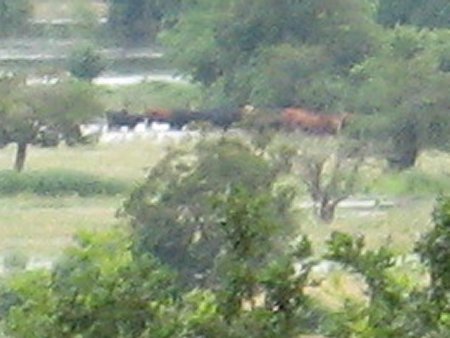
FL3225. Trapped herd of 36 bullocks, 700 yards from nearest road.
 |
HEML3185. Overgrowth of grass and poison hemlock.
 |
FL3209. Overgrowth of musk mallow and oxeye daisy.
 |
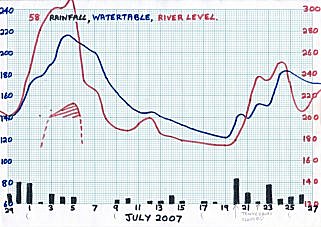
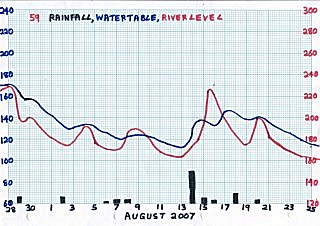
8. River and groundwater levels at Bear Mead in 2007
|
31 May - 28 Jun 2007
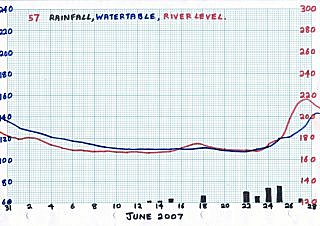 |
29 Jun - 27 Jul 2007
 |
28 Jul - 25 Aug 2007
 |
|
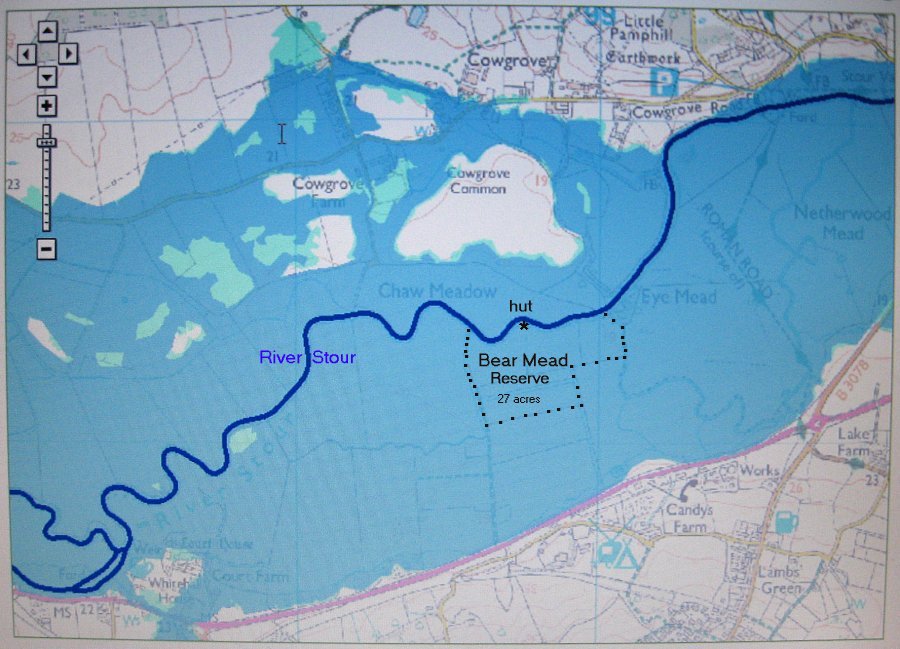
9. Floodplain around Bear Mead |
Flood plains prone to flooding around Bear Mead.
Up to 800 metres South and 1000 metres North of river.
Several islands stand above likely
flooding North of the river, but none in South up to A31
Scale 15,000:1. Dark blue: 1 in 100 chance of flooding each year.
Light blue: 1 in 1,000 chance.
|
Compiled, formatted, hyperlinked, encoded,
and copyright © 2012, John Palmer,
 All Rights Reserved. All Rights Reserved.
|