Updated 04 Dec 2012
|
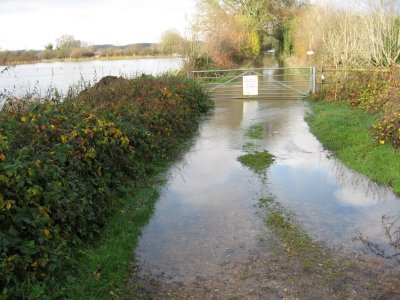
Flood on Dorset Stour 21-26 Nov 2012
|
|
Floods on Dorset Stour 21-26 Nov 2012.
|
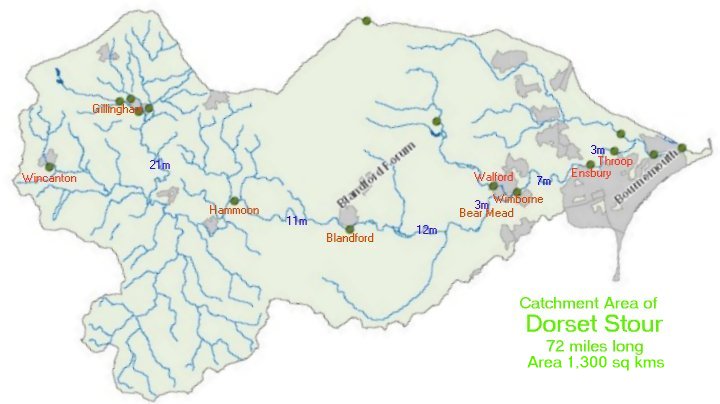
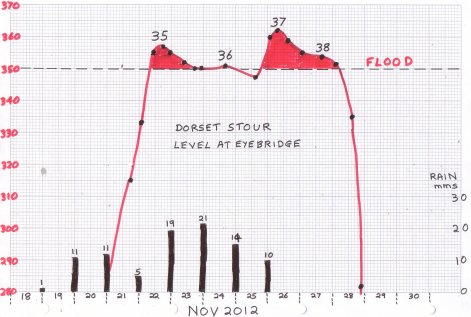
Between 20-26 Nov 2012 around 90 mms of rain fell
on the catchment area of the Dorset Stour (1,300 sq kms). Groundwater
was already very high, and 4 rain-surges were produced
at Gillingham monitor station named 35, 36, 37 and 38.
The peaks were: 35: 1600 21nov, 36: 0300 23nov, 37: 0500 25nov,
and 38: 0800 26nov. Each peak caused flooding further downstream,
which had no time to clear before the next peak arrived. The result
was an unusual inundation of the Stour floodplains for around
8 days. Finally the rain stopped, the river dropped and the floods
and groundwater drained away. Similar or worse floods occured
countrywide at the same time, and many people were again realising
the value of living on a hill.
|
INDEX
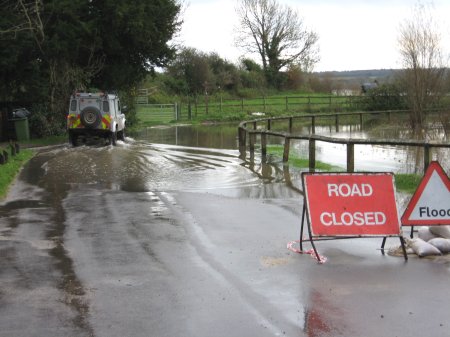
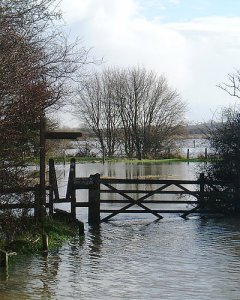
1. Flood photos
2. Catchment area
3. Surges at Gillingham
4. Peaks-and-delays
5. River Stour graphs
|
Flooded Eye Mead taken from Pamphill 1135 hrs 23nov2012,
between peaks 35 and 36.

|
White Mill bridge
|
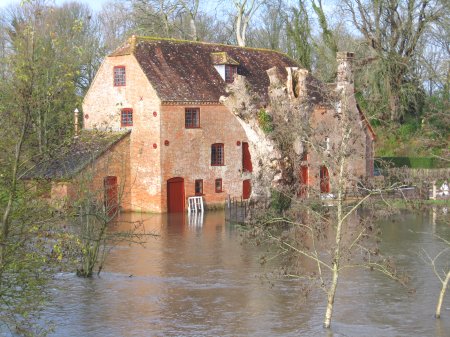
White Mill
|
|
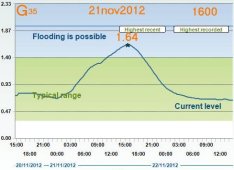
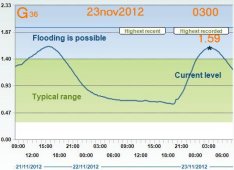
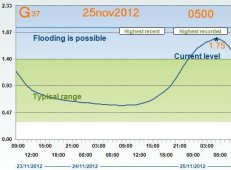
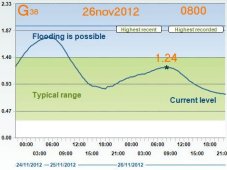
3. The 4 surges at Gillingham
|
Surge 35
 |
Surge 36
 |
Surge 37
 |
Surge 38
 |
|
Graphs copyright Environment Agency
|
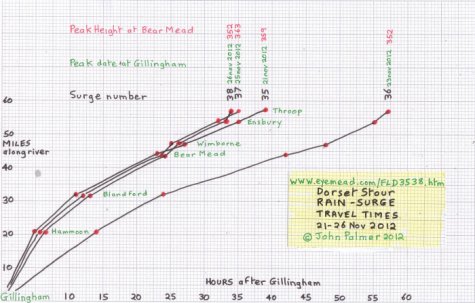
Records for obvious rain-surge peaks, from Monitor stations
at
Gillingham, Hammoon, Blandford, Bear Mead, Wimborne, Ensbury, Throop,
about 57 miles of the Dorset Stour; and the delays between these
stations.
240
Environment Agency graphs, from which these records derive,
are held for private use by the webmaster  .
Notice the large variation in delay times. Asterisks * indicate flood
peaks. Close peaks tend to unite as they move downstream. .
Notice the large variation in delay times. Asterisks * indicate flood
peaks. Close peaks tend to unite as they move downstream.
|
Eyebridge carpark.
|
STOUR peak heights (metres)
and surge delays (hours)
 21nov 23nov 25nov 26nov 2012
  35    36    37    38   Place
 1.64* 1.59* 1.75* 1.24* Gillingham
   5    14     5     6
 2.98* 2.82* 3.06* 2.86* Hammoon
   6    10     7     7
 1.93* 1.52* 2.09* 1.63* Blandford
  12    18    11    10
  359*  352*  362*  352* Bear Mead
   4     6     2     3
 1.55* 1.40* 1.67* 1.48* Wimborne
   8     7     7     7
 3.06* 2.90* 3.19* 2.95* Ensbury
   4     2     3     1
 1.50* 1.36* 1.62  1.48* Throop
 [39]  [57]  [35]  [34]  Total
  W     NW    SSE   WNW  Wind
|
From A31, 700 yards from river.
|
|
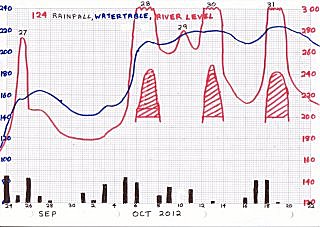
24 Sep - 22 Oct 2012
 |
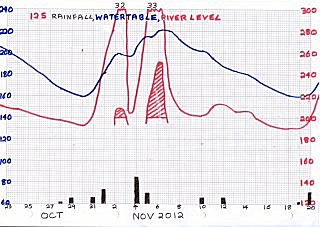
23 Oct - 20 Nov 2012
 |
21 Nov 2012 - 19 Dec 2012
CHANGE of SCALE
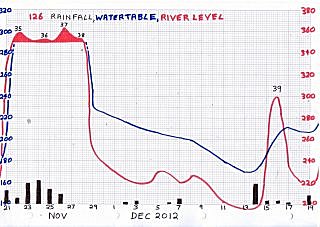 |
Rain-Surge Travel Times from Gillingham to Throop 21-27 Nov 2012.
|
River height at Eyebridge 21-28 Nov 2012
|
|
Compiled, formatted, hyperlinked, encoded,
and copyright © 2012, John Palmer,
All Rights Reserved.
|